 Aziz Mostoba
Designing Analyzine: Analytics That Speaks Your Language
Fewer charts. Clearer answers.
Here's something every product designer learns the hard way. Users don't come to a dashboard for data. They come with a question.
For a site owner, that question is usually pretty simple: "What's bringing in the money?"
That's the question I'm designing Analyzine around. It's a WordPress analytics plugin I'm co-founding with Sadiq Ahmad and Hasan Misbah, and the waitlist is open now.
The problem with most analytics screens
Most analytics tools are built by people who think in systems. So the screens speak the system's language: sessions, dimensions, attribution models, bounce rates.
None of that is wrong. But a shop owner shouldn't need a course to find out which campaign sold the most last week.
The cost of that confusion is real. People stop opening the dashboard, and decisions go back to gut feeling.
Three rules I kept coming back to
1. Use the customer's words. If a term needs a glossary, it needs a better label. When a technical word can't be avoided, it should come with a plain explanation.
2. One question per screen. Where did visitors come from, which pages led to sales, and where did people drop off? Each view answers one of these well.
3. Stay calm and stay home. Analyzine lives inside wp-admin. No new account, no separate dashboard, and no wall of competing charts.
Designing the journey timeline
The screen I'm most excited about is the journey timeline. It turns a session into a short story you can read top to bottom.
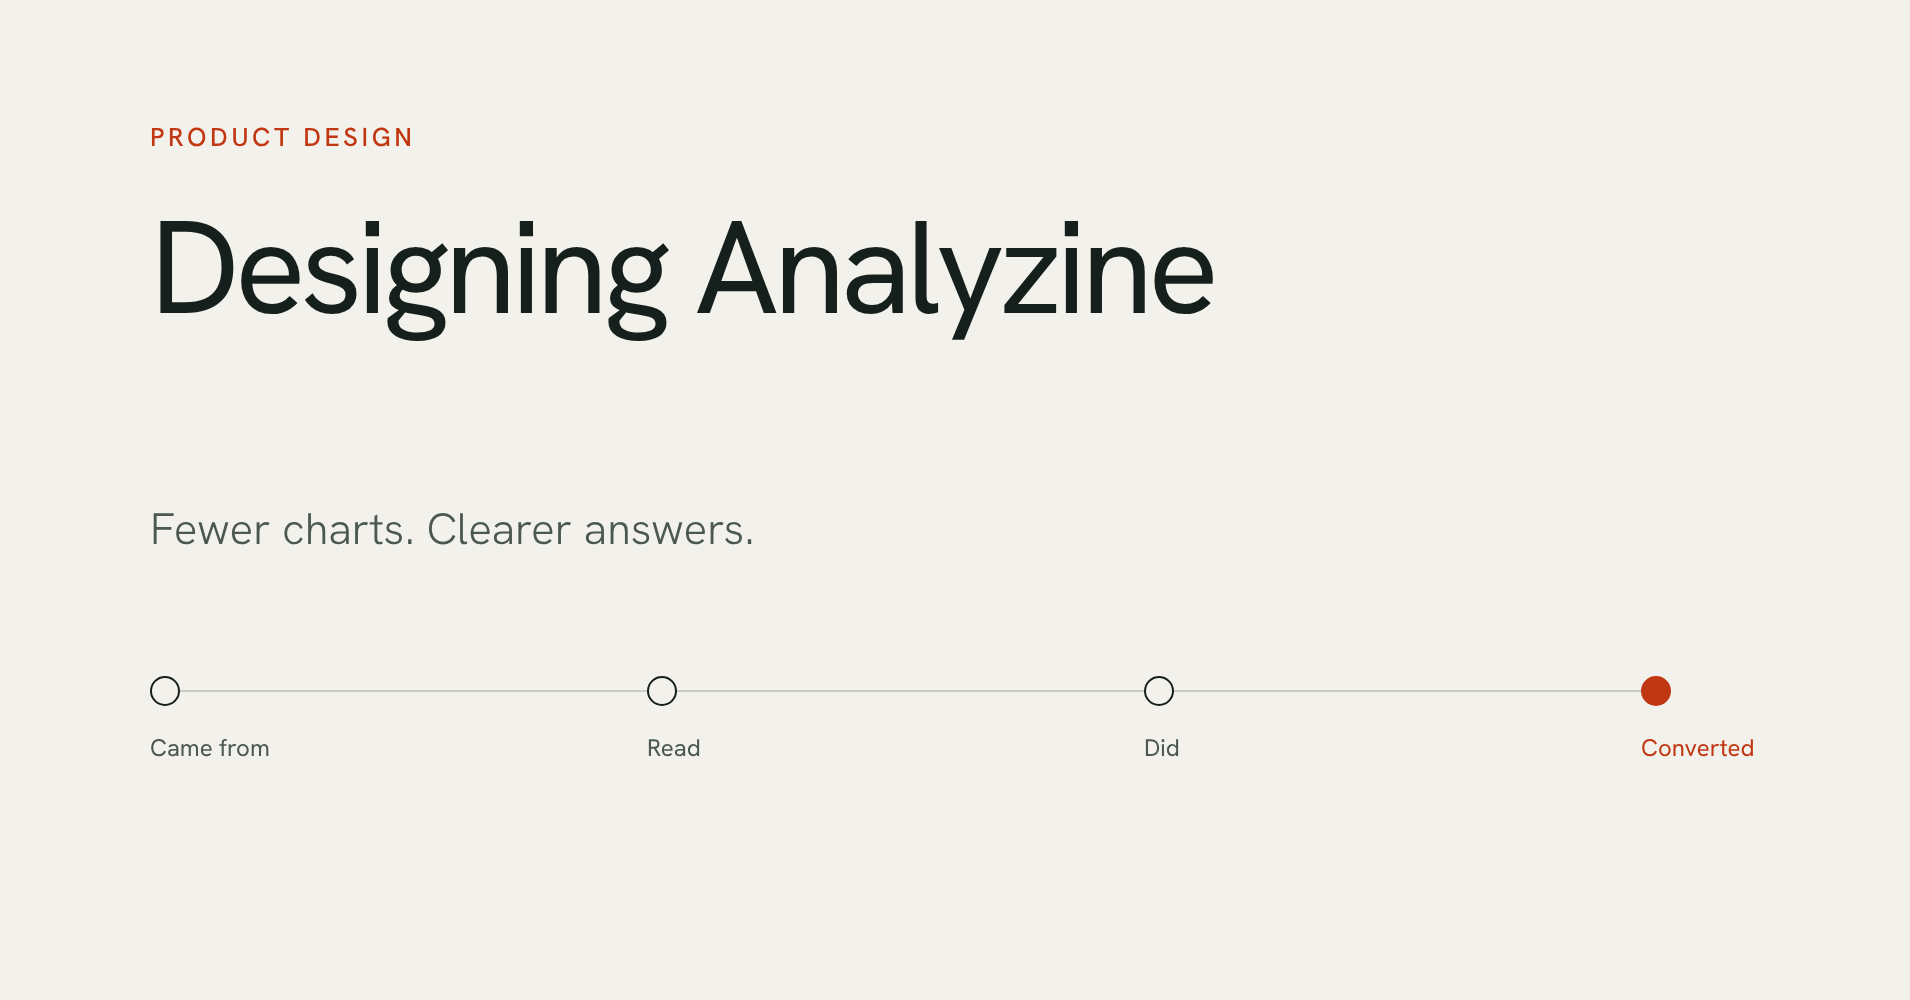
It shows where the person came from, the pages they read, the actions they took, and the moment they converted.
Say you're looking at a booking. Instead of a table of events, you see the path: a newsletter link, two blog posts, the pricing page, then the booking. You get the answer before you even think about the data.
Making privacy readable
Privacy settings are usually a list of toggles with no consequences attached. We wanted the opposite.
The Privacy Audit screen checks your live settings and says plainly what, if anything, leaves your server. It goes criterion by criterion, showing what's met and which setting would change it.
Wrapping up
Good analytics design isn't about showing more. It's about answering the real question fast, in words the owner already uses.
If that sounds like the dashboard you've been missing, I'd love your feedback before launch. We're aiming for the first week of December.